

TL;DR: Collecting marketing data does not automatically improve decisions. DigitalApplied’s statistics compilation reports a gap between the importance marketers place on data and their confidence in its quality, but it does not establish a Pakistan-specific benchmark. Pakistani businesses need data-to-decision pipelines: reliable inputs, clear interpretation rules, and named people responsible for acting. A dashboard becomes useful when it helps someone decide what to change, why, and how to check the result.
Marketing teams invest in dashboards, analytics tools, and reporting infrastructure to capture clicks, impressions, and transactions. The assumption is understandable: better visibility should produce better decisions. But visibility alone cannot tell a team which campaign deserves more budget or which customer problem needs attention.
DigitalApplied’s compilation reports that 87% of marketing leaders consider data-driven decisions critical, while 32% of marketers express high confidence in their data quality. Treat these as figures reported by a secondary compilation, not a survey of Pakistani businesses or proof that every team faces the same gap.
Consider a hypothetical Pakistani ecommerce brand. It installs Google Analytics 4, connects Meta Ads Manager, integrates its CRM, and starts exporting spreadsheets. The marketing manager can see campaign activity but still cannot answer the CFO’s question: “Which spending actually produced profitable orders?” The data exists. The decision remains unresolved.
Data-to-decision pipelines are structured workflows that transform fragmented marketing data into specific business actions. Their value comes from connecting evidence to a decision, then checking whether that decision worked. Speed matters, but so does knowing when the evidence is too weak to act.
Why Do Pakistani Dashboards Show Data But Not Decisions?
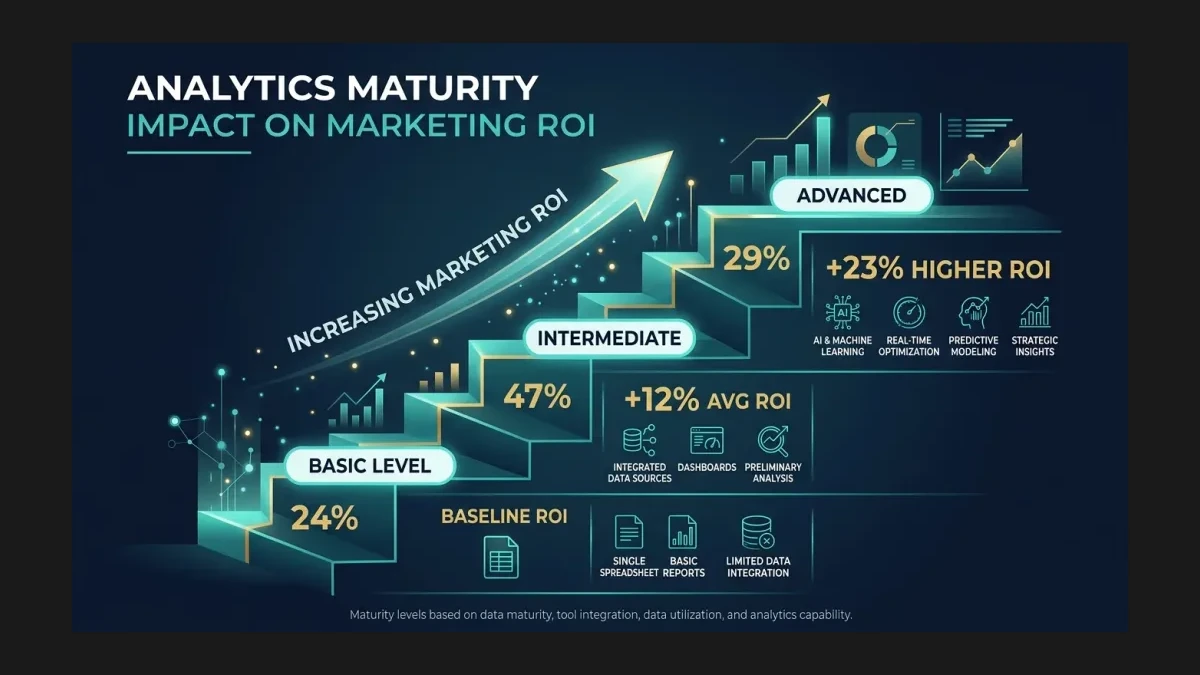
Treat the figures in this illustration as claims from the original statistics compilation, not verified Pakistani benchmarks or promised results.
An IBM article published in 2024, citing Gartner, reported that analytics and business intelligence tools were used by only 29% of employees on average in surveyed organizations. That is historical context, not a fresh adoption measurement. It illustrates why buying access to analytics and making analytics useful are different tasks.
A fashion brand’s dashboard might show impressions, reach, clicks, conversion rates, acquisition costs, and revenue. These help explain what happened. They do not independently decide whether the team should change creative, adjust targeting, or hold the budget steady. That requires business context: margins, stock availability, campaign objectives, and the reliability of the underlying tracking.
Suppose Instagram Reels CPM rises. An automatic budget cut could be the wrong response if conversion quality improves at the same time. A useful pipeline checks acquisition cost and order contribution, flags the change, and sends the evidence to the person responsible for creative or media buying. The threshold starts an investigation; it does not settle it.
“Measuring AEO is a major challenge right now, where the same prompt returns different answers across models, sessions, users, and geographies, meaning any single measurement is a sample not a census.” — Courtney Herda, VP of Digital at LeadCoverage
Herda’s observation concerns answer engine optimization. The broader lesson is to understand each measurement’s limitations, rather than declare every marketing dataset a sample. An order ledger and a visibility test answer different questions. Neither should be used outside its scope without checking what it includes and excludes.
A practical marketing analytics dashboard setup connects metrics to those questions. Define who reviews an alert, what they check, and which actions they can authorize. Include a route for investigating missing or delayed data before treating a sudden movement as a business problem.
Think of the display cases at Liberty Market in Lahore. Showing fabrics gives a buyer options; asking what they need helps them choose. Marketing dashboards provide the display. The decision pipeline supplies the questions that turn information into a useful choice.
What Is the Real Cost of Unused Marketing Data?
Unused data carries costs through storage, processing, subscriptions, and staff time. DigitalApplied’s data-volume estimate concerns enterprise marketing stacks; it should not be presented as the workload of a typical Pakistani SME. A smaller business needs an inventory of its own expenses, including the time spent fixing exports and reconciling conflicting reports.
Start with the recurring work. Who downloads campaign results? Who matches orders to payments? Who explains why the advertising platform and finance report disagree? If that effort produces a presentation but no decision, the reporting process deserves scrutiny. A polished dashboard can still leave the business paying for manual work behind the scenes.
AI analytics adds another layer to this calculation. A tool may summarize results quickly, but a readable summary is not evidence of financial return. Ask whether it reduces a defined task, improves a forecast that someone uses, or helps a team take an action it can evaluate. Without that connection, adoption tells you little about value.
There is no verified Pakistan-wide spending benchmark in the cited material. Budget from the decisions your business needs to support. A retailer reconciling paid orders has different requirements from a SaaS company analyzing renewals. Subscription prices are only part of the cost; implementation, maintenance, and staff ownership also need funding.
Every prominent dashboard metric should answer: “If this changes, what do we investigate or do?” Sometimes the right answer is to wait for more evidence. That is still a decision if the team documents why it is waiting and what would change its mind. “We discuss it at the next meeting” is incomplete without an owner and a clear question.
A useful audit therefore works backward from recent decisions. Identify the data that influenced them, the information that arrived too late, and the reports nobody used. Retire duplicate views and repair important gaps before purchasing another reporting layer. Keep diagnostic data accessible without giving every available metric equal prominence.
How Do Predictive Analytics Change the Data-to-Decision Equation?
Predictive analytics uses statistical techniques and machine learning to estimate future outcomes from historical data. In marketing, that can mean identifying customers at risk of leaving, estimating future customer value, or forecasting demand. These estimates support judgment; they do not reveal with certainty who will churn or what someone will buy.
For a Pakistani ecommerce brand, the practical question is whether a prediction changes a useful action. A churn score might help prioritize a retention campaign. A demand forecast might inform stock planning before Eid. Neither creates value merely by appearing on a dashboard: someone must use it, and the business must evaluate the resulting decision.
The original numerical maturity comparisons do not establish what a Pakistani business should expect to earn. Use maturity as a description of working practices instead:
| Analytics Maturity Level | Reporting Practice | Decision Use | Main Limitation |
|---|---|---|---|
| Basic (ad hoc reporting) | Separate exports and manual checks | Investigates problems after they appear | Definitions and ownership may vary |
| Intermediate (regular dashboards) | Shared metrics and scheduled reviews | Supports repeatable operational decisions | Actions can still depend on manual follow-up |
| Advanced (predictive, automated) | Tested forecasts and monitored workflows | Prioritizes interventions and evaluates results | Requires maintenance and checks on model performance |
Before investing in predictive analytics for marketing, agree on the decision the model will support. Compare its predictions with a simple baseline using data unavailable during model development. Then evaluate the intervention separately: accurately predicting churn does not prove that a discount will prevent it profitably.
For brands responding to Daraz promotions, Eid campaigns, and competitor offers, timely information can matter. A retailer that spots a checkout problem while a campaign is active has an opportunity to investigate sooner. But a fast alert based on incomplete tracking can also waste time. Freshness and reliability belong together.
The pipeline needs collection, interpretation, and activation. Collection brings relevant advertising, analytics, and order data together. Interpretation checks quality and identifies meaningful changes. Activation assigns a response, records the decision, and checks its outcome. Automation can support each stage, while consequential budget or customer-facing changes may still need human review.
A marketing data warehouse setup can support this process when separate systems need consistent definitions and historical records. Start with the sources required for the decision at hand. Connecting every available platform is not a prerequisite for making the first workflow useful.
What Should Pakistani Businesses Measure Instead of Tracking Everything?
In his article on smart KPIs, Avinash Kaushik argues for accountability and outcomes over activity. Cost per session can describe traffic efficiency, but it cannot establish whether that traffic produces useful business results. The same applies to a report full of clicks: activity needs a connection to what the business wants customers to do.
Cost per click (CPC) is the amount paid for an ad click. A cheaper click is not automatically better if the visitor never becomes a profitable customer. Compare traffic quality and downstream outcomes before celebrating lower acquisition inputs. Search intent, landing-page relevance, and the offer all affect what happens after the click.
For customer acquisition decisions, define exactly what counts as an acquisition. A lead, a placed order, and a paid order are different outcomes. Compare acquisition spending with the value those customers produce, using consistent treatment of cancellations and refunds. Otherwise, apparently efficient campaigns can look stronger than their contribution to the business.
Customer lifetime value (CLV) estimates value over the customer relationship. State whether your dashboard uses revenue or contribution after relevant costs, and whether the value is observed or predicted. That definition matters when comparing a channel that attracts repeat buyers with one that produces mostly single purchases.
Incremental ROAS addresses a different question: how much additional conversion value did the advertising cause? Google’s Conversion Lift documentation defines it as incremental conversion value divided by total ad spend. The control group is held back from the advertising being tested; it does not necessarily receive no marketing at all.
Attributed ROAS and incremental ROAS should therefore be labeled separately. Use experimental evidence where available, and avoid presenting ordinary channel reports as proof of causation. A dashboard should make the limits of its answer visible alongside the answer itself.
Set Up Your Data Pipeline Around a Focused Set of Metrics
For an ecommerce business, the original shortlist remains a useful starting point: CLV by acquisition channel, incremental ROAS where measured, conversion rate by traffic source, cart abandonment, and customer retention. Adapt it to the business model. A B2B company may need qualified opportunities and renewals instead of cart behavior.
Each prominent metric needs an owner, a review trigger, and a defined response. For conversion rate, the response might begin with checking tracking and checkout availability. For retention, it might involve reviewing customer cohorts before changing offers. Thresholds should reflect normal variation and commercial constraints, rather than an arbitrary target copied from another business.
Record the decision alongside the evidence. Note what changed, who acted, and when the outcome will be reviewed. This creates a useful memory for the team: which interventions helped, which did not, and which could not be evaluated because the data was incomplete. The dashboard then supports learning as well as reporting.
Pipeline work also continues after launch. Campaign structures change, tracking breaks, and customer behavior shifts. Budget for maintenance and review instead of assuming that implementation is a one-time investment with guaranteed payback. Begin with a manageable decision and expand when the workflow is reliable enough to trust.
WeProms Digital designs data-to-decision pipelines for businesses that need clearer links between marketing activity and commercial outcomes. Discuss the decision you need to improve via hello@weproms.com or WhatsApp at +92 300 0133399.
Read next: Why Pakistani marketing dashboards show bad data | The SIGNAL Framework for marketing measurement
Frequently Asked Questions
Why do Pakistani businesses collect marketing data they never use?
A common failure is installing analytics tools before defining the decisions they should support. Data becomes difficult to use when definitions conflict, ownership is unclear, or reports arrive after a decision is needed. The cited sources do not establish how widespread these problems are among Pakistani businesses.
What is a data-to-decision pipeline?
It is a workflow that connects data collection, interpretation, and action. Relevant information from systems such as GA4, advertising platforms, and a CRM is checked and interpreted against a business question. A named owner then takes or approves a response and reviews the outcome, rather than stopping at a report.
How much should Pakistani businesses spend on marketing analytics?
Start with the decisions, data sources, and maintenance work required. Include staff time as well as software and implementation costs. The cited material does not provide a dependable Pakistani SME spending benchmark. Fund a useful workflow, evaluate its value, and expand when additional reporting or modeling has a clear purpose.
What marketing metrics should Pakistani businesses track?
For ecommerce, start with customer value by acquisition channel, measured incremental ROAS where available, conversion rate, cart abandonment, and retention. Adapt the shortlist to your business model. Keep supporting diagnostics available, but give dashboard prominence to metrics with an owner, a review trigger, and a defined decision attached.
How does predictive analytics help Pakistani ecommerce brands?
It can estimate churn risk, future customer value, or demand so teams can prioritize action. Predictions remain uncertain and need validation against later outcomes. Evaluate whether the resulting intervention helps the business; an accurate churn model alone does not prove that the retention campaign it informs is profitable.
Who builds data-to-decision pipelines for Pakistani businesses?
WeProms Digital helps Pakistani SMEs and ecommerce brands connect marketing data with defined business decisions. The scope can include unified reporting, quality checks, alerts, and response workflows. Contact the team through WhatsApp or email to discuss the sources, decisions, and internal owners involved.
How long does it take to build a marketing decision pipeline?
Timing depends on source access, tracking quality, integration complexity, and agreement on metric definitions. A reporting workflow needs a different scope from predictive modeling or automated campaign changes. Agree on milestones after reviewing the data, and allow for validation and maintenance. Neither a delivery deadline nor an ROI timetable should be assumed before that review.
Key Takeaways
- Collecting data creates visibility; improving decisions requires definitions, ownership, and a response workflow.
- The cited statistics compilation does not establish Pakistan-specific adoption rates, spending benchmarks, or expected returns.
- A dashboard alert should prompt an appropriate check, with data quality and commercial context considered before action.
- Predictive analytics estimates future outcomes. Test both prediction quality and the value of the intervention it informs.
- Keep the main dashboard focused on decisions, while retaining diagnostic data for investigation.
- Review outcomes and maintain the pipeline after launch. More tools alone cannot resolve unclear responsibilities or inconsistent measurements.
About WeProms Digital
WeProms Digital is a marketing analytics and digital strategy agency headquartered in Lahore, serving Pakistani SMEs, ecommerce brands, and B2B companies across Lahore, Karachi, Islamabad, Rawalpindi, Faisalabad, and Multan.
The team works on data-to-decision pipeline design, GA4 configuration, and marketing measurement frameworks. Its marketing measurement strategy and reconciliation service helps businesses connect reporting definitions with the commercial questions they need to answer.
Get in touch: hello@weproms.com · WhatsApp +92 300 0133399
Sources & References
- DigitalApplied — Marketing Analytics Statistics 2026 — Secondary statistics compilation; not a Pakistan-specific survey.
- The Virtual Forge — Why Your Dashboards Aren’t Driving Decisions
- Occam’s Razor by Avinash Kaushik — Smart KPIs: Accountability Over Outcomes
- LeadCoverage — AEO Scorecard for AI Visibility
- MarTech Series — Data-to-Decision Pipelines in Martech
- Databricks — Guide to BI Reporting
- Improvado — Data-Driven Decision Making
Additional reading from industry feeds: